Data exploration and visualization
Introductory notes
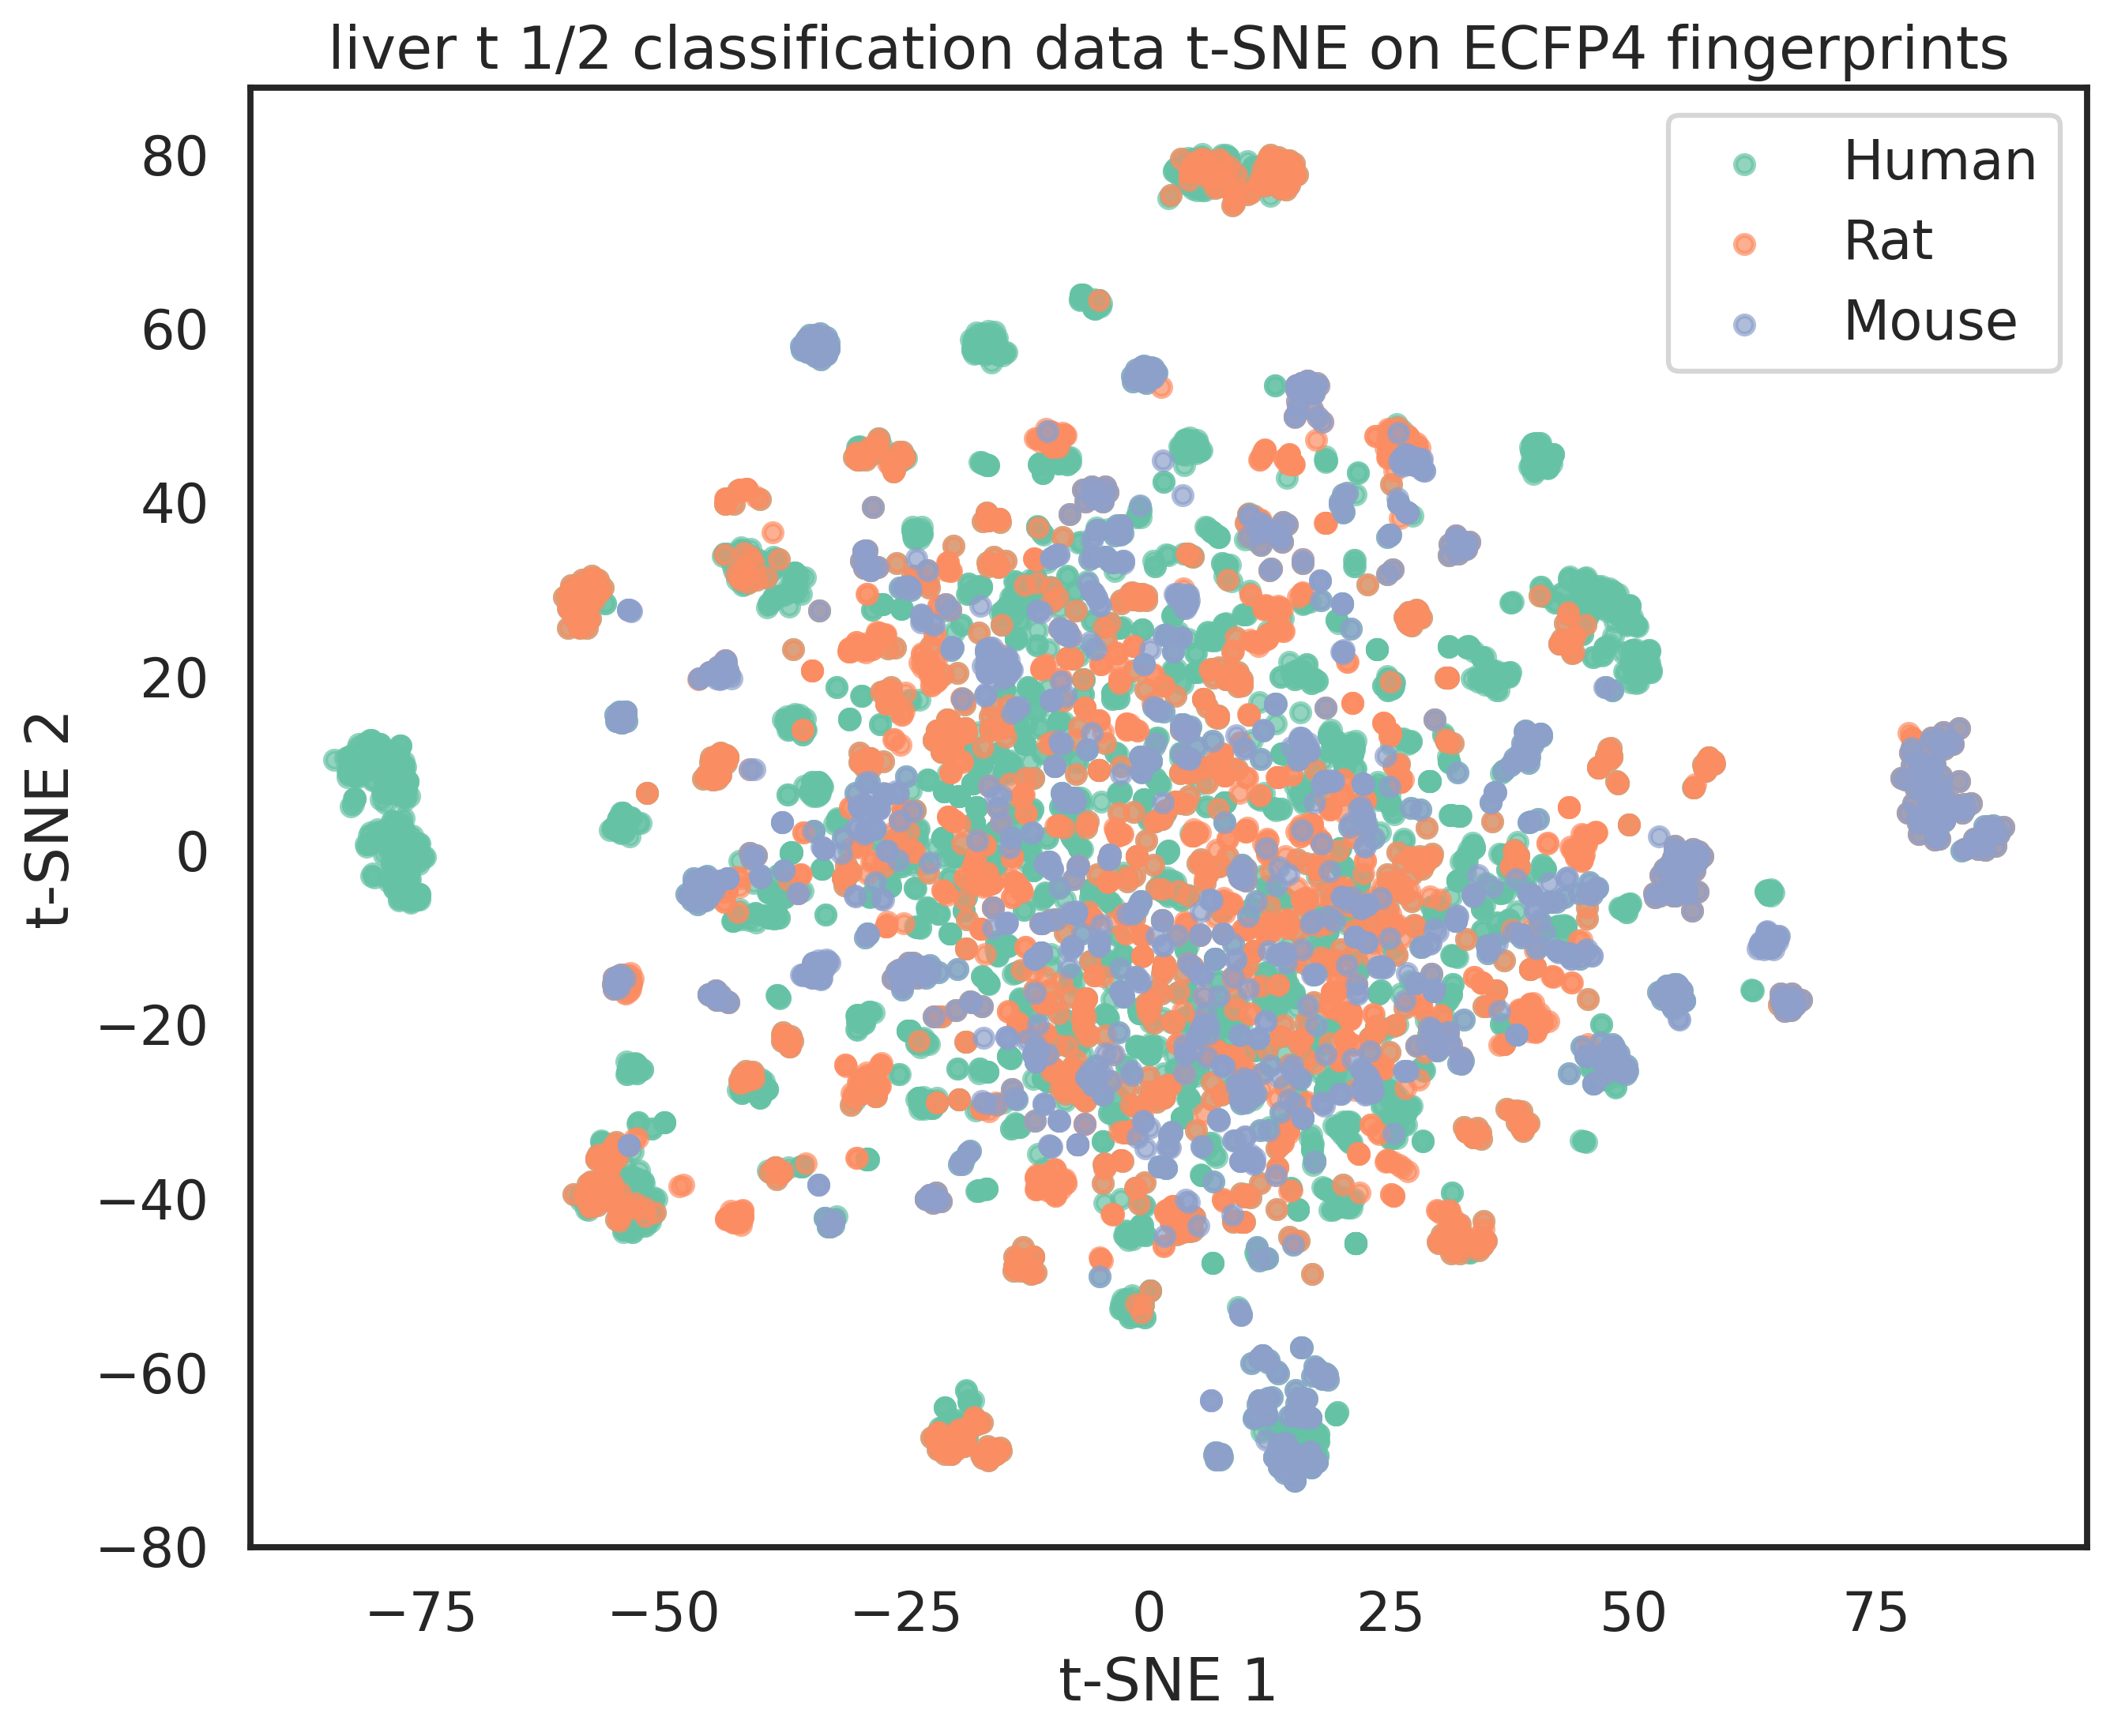
ADMET-XSpec supports creating PCA projection visualizations in 2 or 3 dimensions, as well as t-SNE and UMAP visualizations in 2 dimensions.
Goals
After reading this section, you should understand:
How the
ReducerBaseandVisualizerBaseclasses workHow to choose the right
processing_planfor data exploration and visualization
The VisualizerBase interface, implemented only by ProjectionVisualizer, takes a dictionary of pandas dataframes where the string keys are the dataset friendly_names and the values are the datasets.
VisualizerBase exposes a public get_visualization method and enforces that the implementing class handles conversion to numpy form (as expected by matplotlib) inside _get_visualizable_form.
The public get_visualization method expects data that has been “reduced” - i.e., passed through an implementation of the ReducerBase interface.
ReducerBase is composed of a VisualizerBase class: for our current PCA, t-SNE, and UMAP visualizations, it is always ProjectionVisualizer. It exposes the public get_reduced_df method, which maps the features of a preprocessed (non-null, canonicalized, normalized & featurized) dataset - i.e., its columns - into the reducer’s lower-dimensional output.
This pairing of get_reduced_df and get_visualization is exploited in ProcessingPipeline, specifically whenever do_visualize_datasets or do_visualize_train_test are enabled in a processing plan.
An example of a generated visualization is provided here: